Portfolio returns: Q2 2026
| Total Return | 1M | 3M | YTD | 1YR | 3YR | 5YR | 10YR | Since Inc. July 12, 2013 |
IG Core Portfolio – Balanced F | 1.61
| 7.77
| 8.18
| 15.67
| 12.53
| 7.44
| 7.37
| 7.48
|
Quartile rankings | 2 | 2 | 2 | 2 | 2 | 2 | 1 |

| Total Return | 1M | 3M | YTD | 1YR | 3YR | 5YR | 10YR | Since Inc. July 12, 2013 |
IG Core Portfolio – Balanced F | 1.61
| 7.77
| 8.18
| 15.67
| 12.53
| 7.44
| 7.37
| 7.48
|
Quartile rankings | 2 | 2 | 2 | 2 | 2 | 2 | 1 |
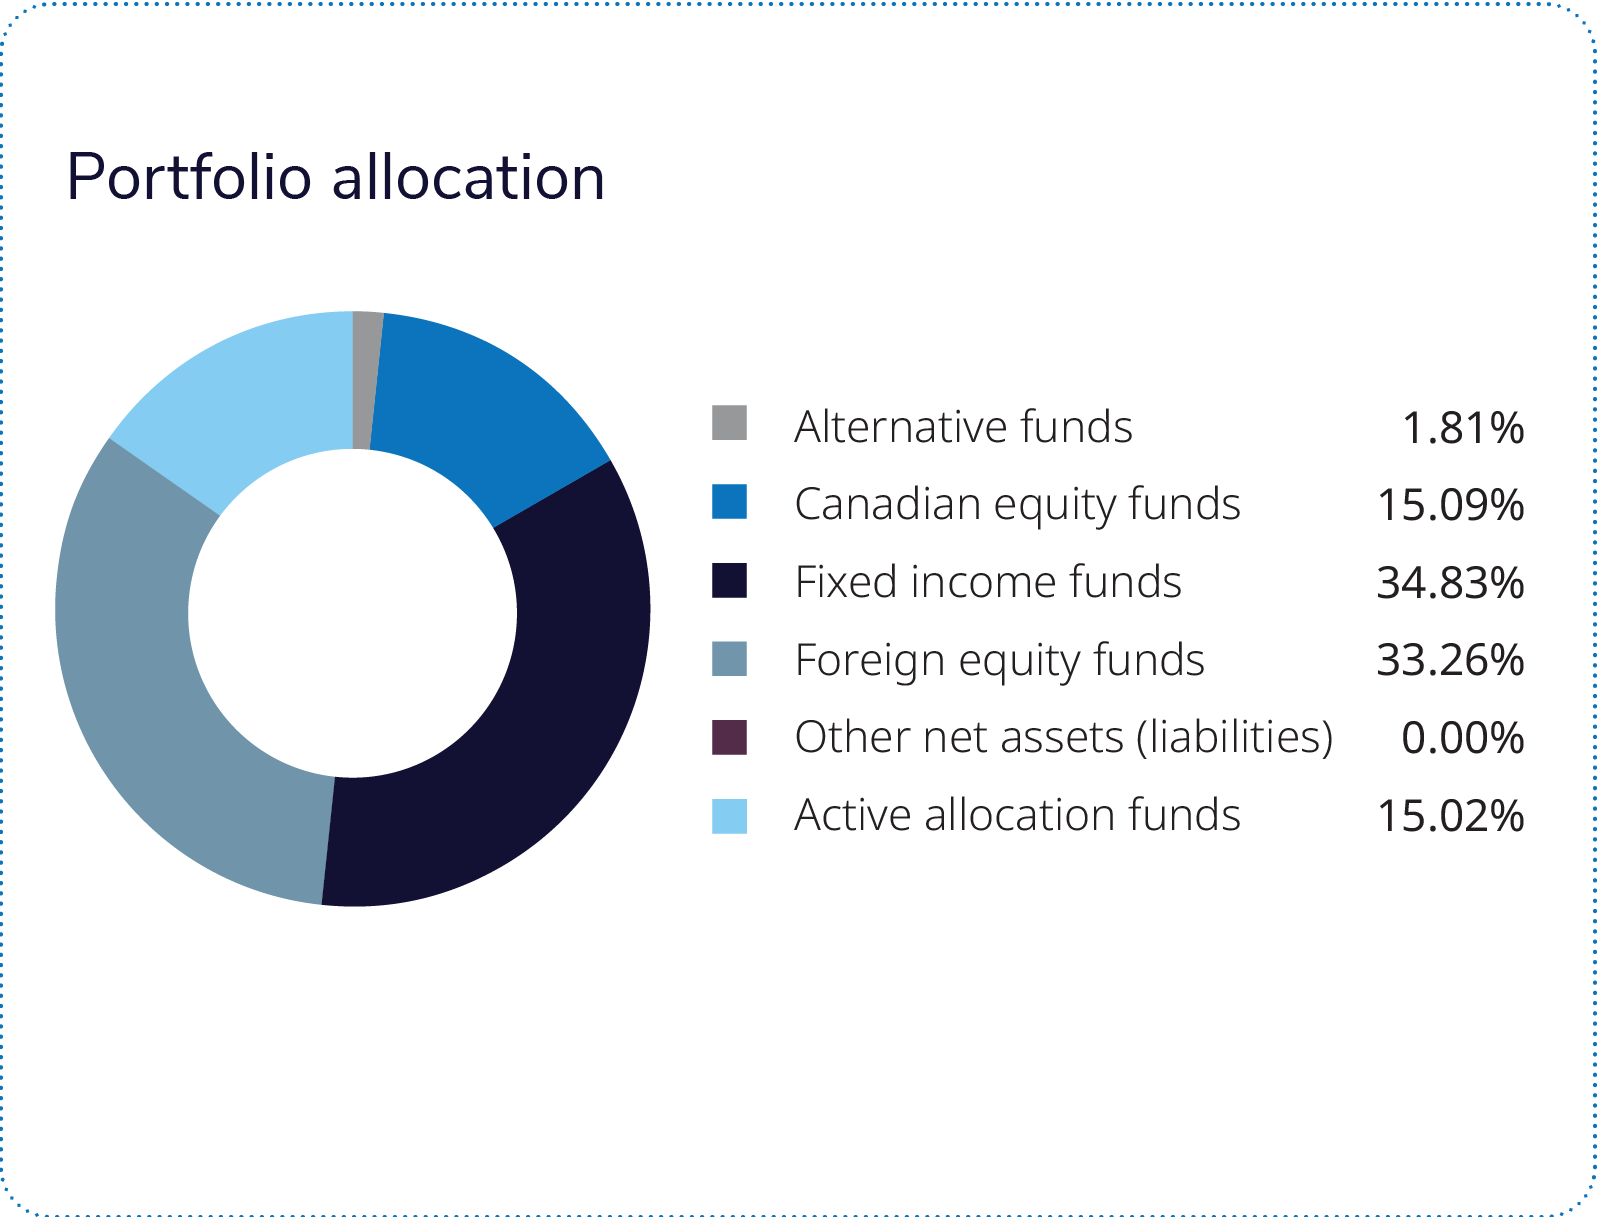 The IG Core Portfolio – Balanced rose by 7.77% over the second quarter of 2026 and outperformed its Global Neutral Balanced peer group median (7.35%), with positive contributions from most component funds and pools. The portfolio benefited most from its U.S. equity components, which were the largest contributors to overall return. All equity components of the portfolio outperformed all fixed income components.
The best-performing portfolio components by return were the JPMorgan-IG Emerging Markets Pool II and the IG Mackenzie Pan Asian Equity Fund, which returned 26.55% and 26.50%, respectively. However, due to their relatively small weights in the portfolio (approximately 2.3% and 2.2%), their direct impact on overall results was limited. The Mackenzie-IG U.S. Equity Pool and the T. Rowe Price-IG U.S. Equity Pool were the top contributors to portfolio performance, generating returns of 15.95% and 13.69%, together contributing approximately 2.59 percentage points to the overall return. The BlackRock-IG Active Allocation Pool II, the portfolio’s largest component at approximately 15.1%, returned 8.98% and was the third-largest contributor to overall portfolio return.
Fixed income components generated modest positive returns for the quarter. The Mackenzie-IG Canadian Bond Pool, the largest fixed income component at more than 18% of the portfolio, returned 2.08% for the quarter and was the top fixed income contributor. The Putnam-IG High Yield Income Pool was the best performing fixed income component, returning 2.55% over the period.
The second quarter of 2026 reinforced the resilience of financial markets. Investors faced conflict in the Middle East, commodity-price volatility, shifting interest-rate expectations and renewed inflation concerns, yet global equities continued to advance as corporate earnings and economic activity remained stronger than expected. The S&P 500 gained 14.9% in U.S.-dollar terms for the quarter, while the S&P/TSX Composite Index advanced 6.4%, supported by healthier earnings expectations and improving market breadth.
Canadian equities were led by a strong rebound in financials, as better-than-expected bank earnings, resilient credit quality and improved capital markets activity lifted sentiment. U.S. equities were supported by earnings strength rather than a simple risk-on rally, with Information Technology leading as AI infrastructure spending continued to anchor sentiment. International equities also contributed meaningfully, with emerging markets Korea and Taiwan benefitting from demand across the global technology supply chain.
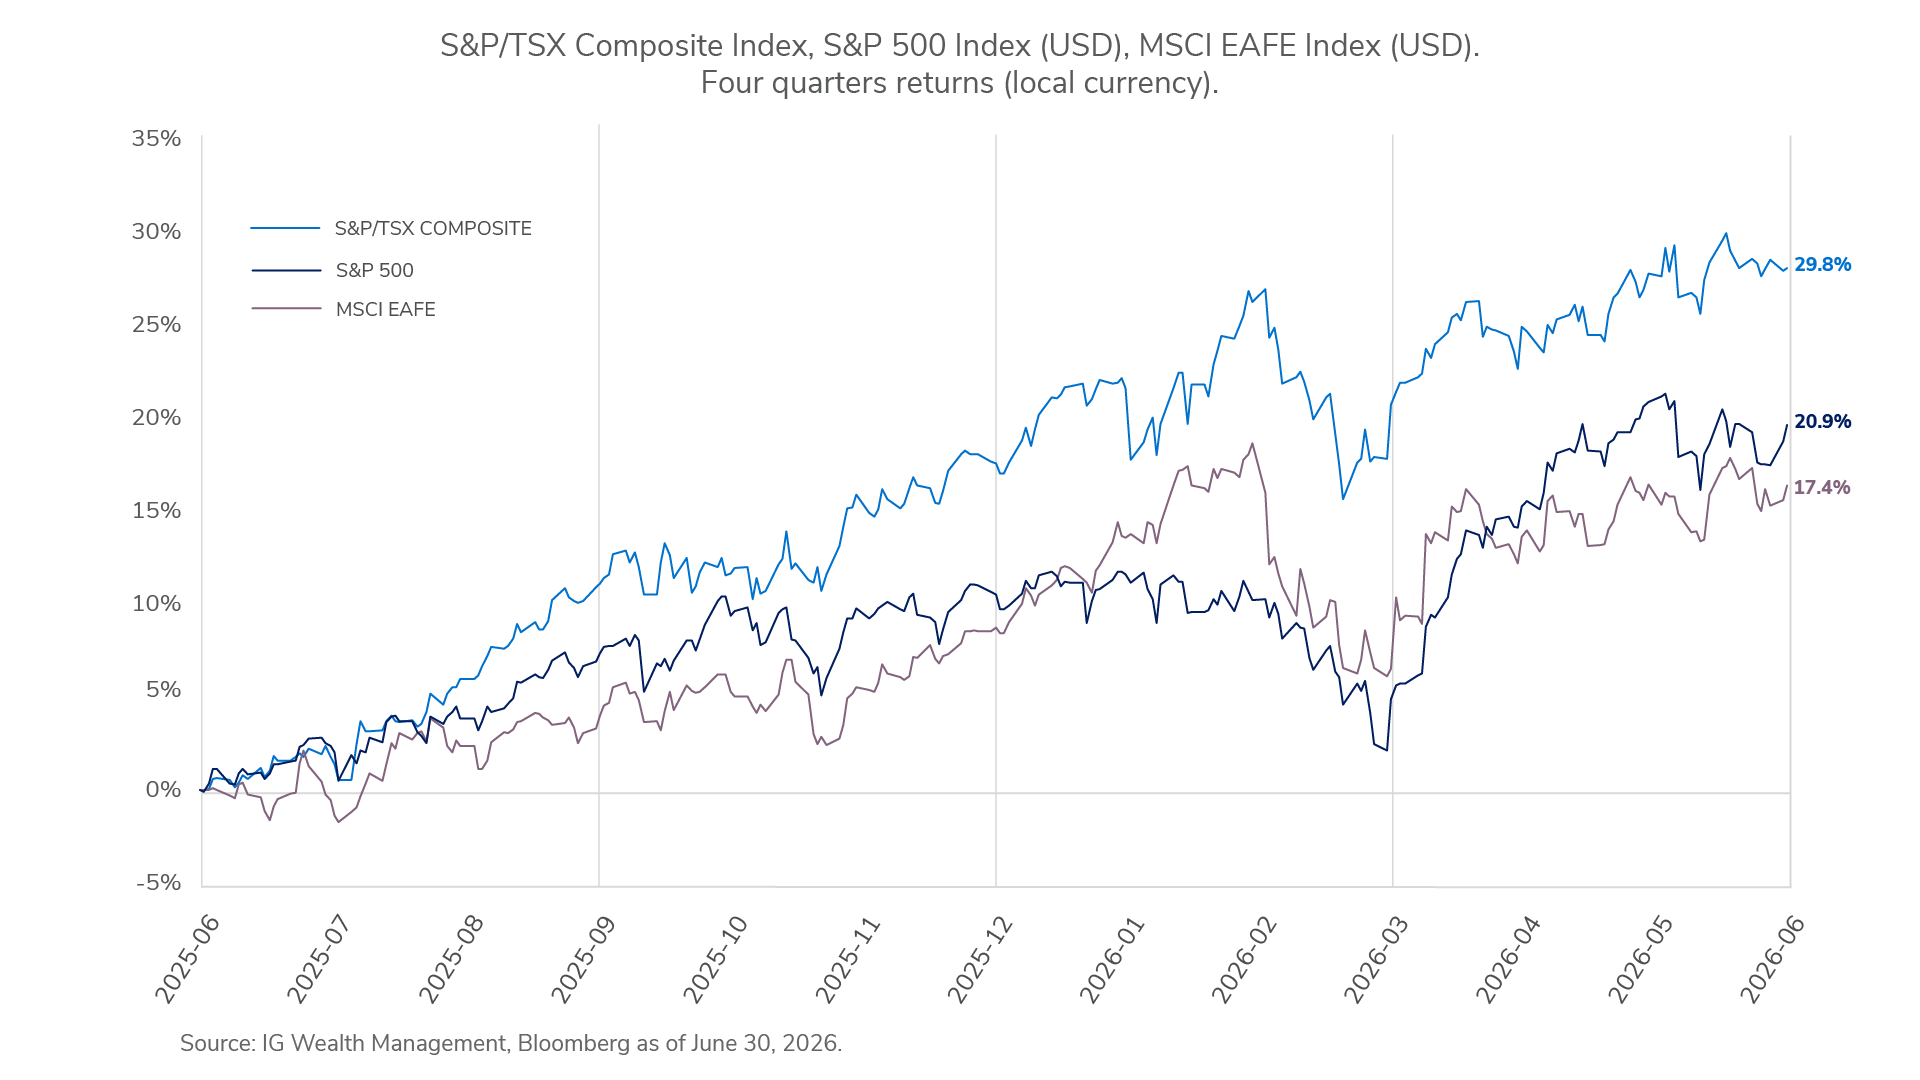
Markets enter the second half of 2026 on a constructive footing. The first half demonstrated that headline risks, including conflict in the Middle East, inflation concerns and commodity price volatility, can create uncertainty without derailing markets, when economic and corporate fundamentals remain intact. Corporate earnings remain the primary support for equities. Manufacturing activity continues to expand, consumer spending has proven resilient, and global trade has improved, providing a favourable backdrop for earnings growth. We expect those trends to continue into the second half of the year. Valuations are less forgiving after a strong first half, and seasonal weakness, U.S. mid-term elections and shifting rate expectations could create periods of volatility. However, we view those setbacks as opportunities rather than a change in trend. Diversification continues to reward investors. A focus on quality and fundamentals, not headlines, has led to better outcomes.
Commissions, fees and expenses may be associated with mutual fund investments. Read the prospectus and speak to an IG Advisor before investing. The rate of return is the historical annual compounded total return as of June 30, 2026, including changes in value and reinvestment of all dividends or distributions. It does not take into account sales, redemption, distribution, optional charges or income taxes payable by any securityholder that would have reduced returns. Mutual funds are not guaranteed, values change frequently and past performance may not be repeated. Mutual funds and investment products and services are offered through the Mutual Fund Division of IG Wealth Management Inc. (in Quebec, a firm in financial planning). And additional investment products and brokerage services are offered through the Investment Dealer, IG Wealth Management Inc. (in Quebec, a firm in financial planning), a member of the Canadian Investor Protection Fund.
This commentary may contain forward-looking information which reflects our or third-party current expectations or forecasts of future events. Forward-looking information is inherently subject to, among other things, risks, uncertainties and assumptions that could cause actual results to differ materially from those expressed herein. These risks, uncertainties and assumptions include, without limitation, general economic, political and market factors, interest and foreign exchange rates, the volatility of equity and capital markets, business competition, technological change, changes in government regulations, changes in tax laws, unexpected judicial or regulatory proceedings and catastrophic events. Please consider these and other factors carefully and do not place undue reliance on forward-looking information. The forward-looking information contained herein is current only as of June 30, 2026. There should be no expectation that such information will in all circumstances be updated, supplemented or revised whether as a result of new information, changing circumstances, future events or otherwise.
This commentary is published by IG Wealth Management. It represents the views of our Portfolio Managers and is provided as a general source of information. It is not intended to provide investment advice or as an endorsement of any investment. Some of the securities mentioned may be owned by IG Wealth Management or its mutual funds, or by portfolios managed by our external advisors. Every effort has been made to ensure that the material contained in the commentary is accurate at the time of publication, however, IG Wealth Management cannot guarantee the accuracy or the completeness of such material and accepts no responsibility for any loss arising from any use of or reliance on the information contained herein.
Trademarks, including IG Wealth Management and IG Private Wealth Management, are owned by IGM Financial Inc. and licensed to subsidiary corporations.
©2026 IGWM Inc.