Portfolio returns: Q2 2026
| Total Return | 1M | 3M | YTD | 1YR | 3YR | 5YR | 10YR | Since Inc. (Jul 12, 2013) |
IG Income – Series F | 1.50 | 4.71 | 5.86 | 11.43 | 9.25 | 4.81 | 4.56 | 4.69 |
Quartile rankings | 1 | 3 | 2 | 2 | 2 | 1 | 2 |

| Total Return | 1M | 3M | YTD | 1YR | 3YR | 5YR | 10YR | Since Inc. (Jul 12, 2013) |
IG Income – Series F | 1.50 | 4.71 | 5.86 | 11.43 | 9.25 | 4.81 | 4.56 | 4.69 |
Quartile rankings | 1 | 3 | 2 | 2 | 2 | 1 | 2 |
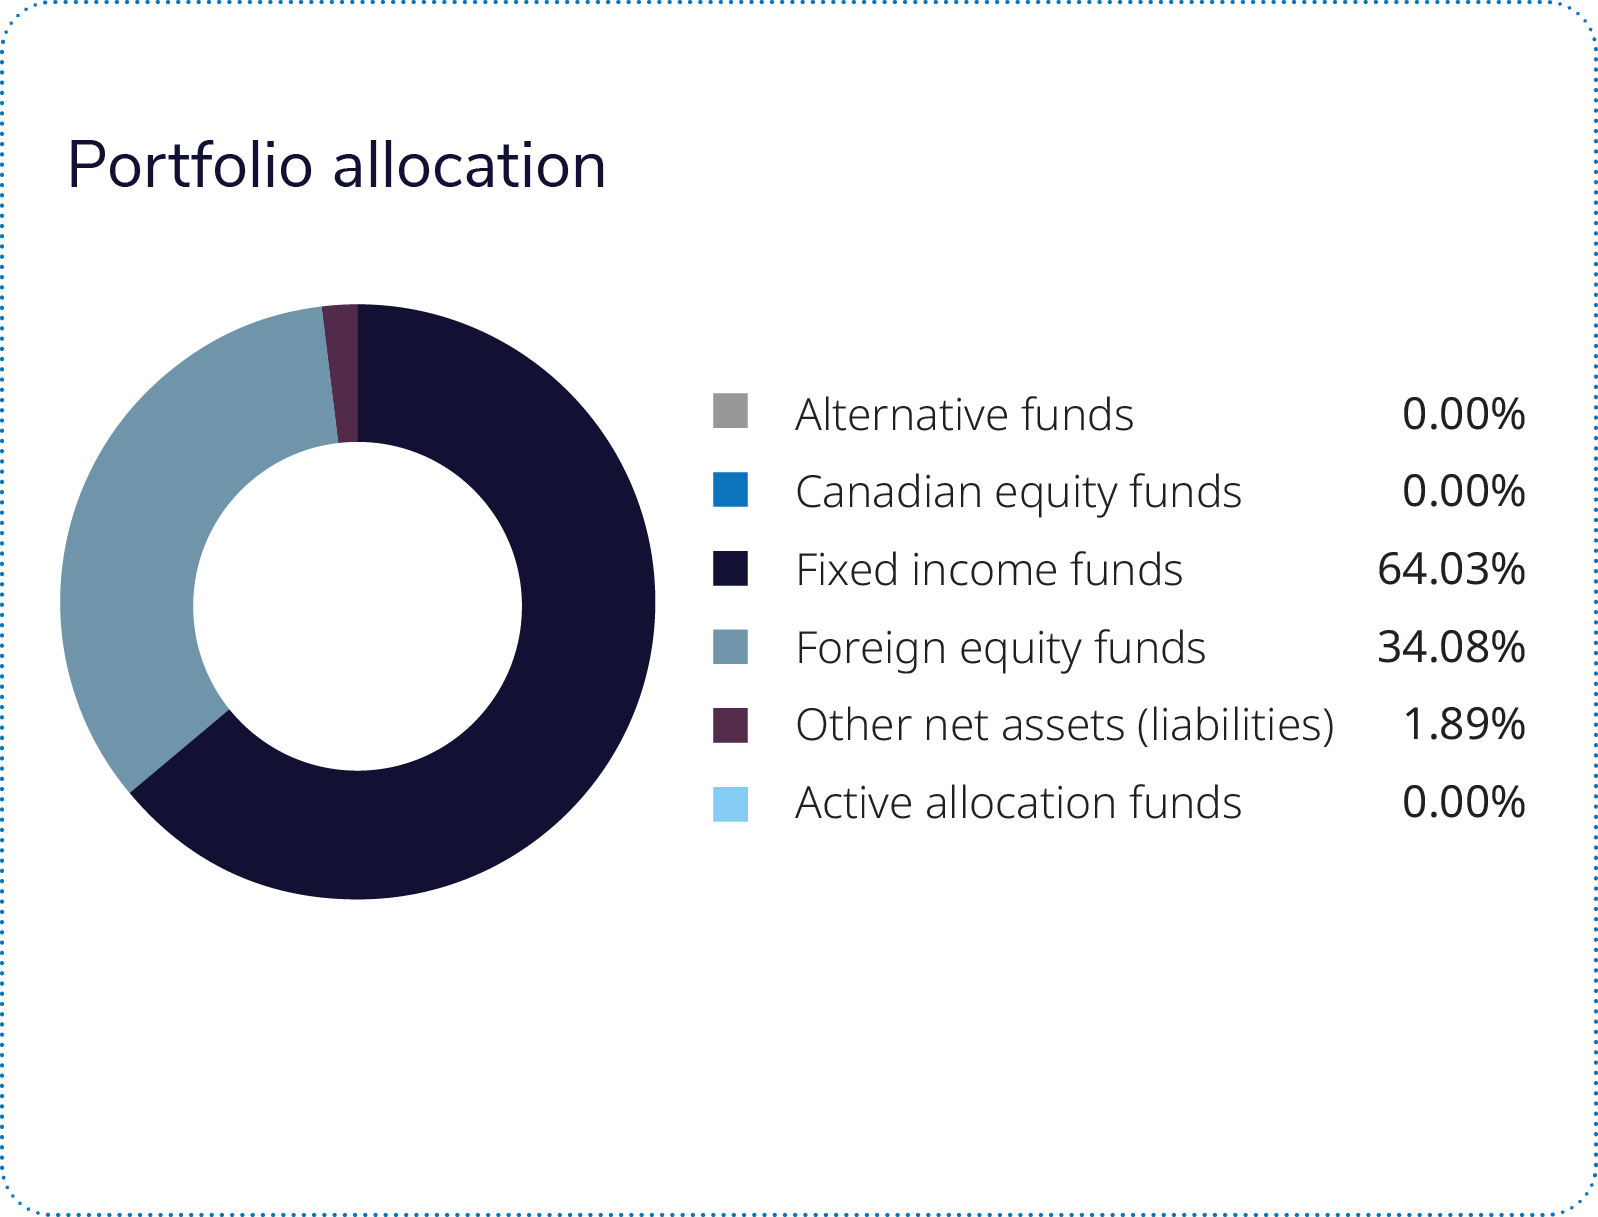 The portfolio was up in the quarter.
Equity exposure, represented by the portfolio’s 34% allocation to the Mackenzie Global Equity Income Fund, was the largest contributor to performance and outperformed its benchmark. Absolute returns were driven by Canadian and U.S. equity holdings, and by performance in the information technology and financial sectors. Stock selection in financials was the largest contributor to relative outperformance, while overweight positions in health care and consumer staples added value. Dividend-paying sectors’ performance was mixed, with the financial sector performing relatively well for the quarter, supported by resilient earnings and improving capital markets activity.
The Mackenzie Global Equity Income Fund also uses a stock options strategy to help preserve capital during times of severe equity market stress. As expected, the options strategy detracted from the returns this quarter, as equity markets rallied; the opposite is expected when equity markets decline.
The Mackenzie Canadian Bond Fund, representing 21% of the portfolio, was a major contributor to performance. The fund generated positive returns, as longer-duration federal and provincial bonds benefited from declining Government of Canada yields. Relative outperformance was driven by active security selection and yield-curve positioning across government bond holdings.
The Mackenzie Unconstrained Fixed Income Fund, representing 28% of the portfolio, was the second-highest fixed income contributor. The fund generated positive returns during the quarter, led by corporate bonds, as tightening credit spreads and strong issuer fundamentals supported performance. Relative outperformance was driven by overweight positions in industrials and energy corporate bonds, together with strong security selection within the industrials sector.
The Mackenzie Sovereign Bond Fund, representing 13% of the portfolio, also posted a positive return. Ten-year Government of Canada bonds were the largest contributor to returns, as declining yields lifted bond prices, while yield curve positioning detracted modestly from relative performance.
The Mackenzie Gold Bullion Fund, representing 2% of the portfolio, was the only fund that performed negatively. Gold declined in Q2, as higher real yields, a stronger U.S. dollar and easing geopolitical concerns outweighed safe-haven demand.
The second quarter of 2026 reinforced the resilience of financial markets. Investors faced conflict in the Middle East, commodity-price volatility, shifting interest-rate expectations and renewed inflation concerns, yet global equities continued to advance as corporate earnings and economic activity remained stronger than expected. The S&P 500 gained 14.9% in U.S.-dollar terms for the quarter, while the S&P/TSX Composite Index advanced 6.4%, supported by healthier earnings expectations and improving market breadth.
Canadian equities were led by a strong rebound in financials, as better-than-expected bank earnings, resilient credit quality and improved capital markets activity lifted sentiment. U.S. equities were supported by earnings strength rather than a simple risk-on rally, with Information Technology leading as AI infrastructure spending continued to anchor sentiment. International equities also contributed meaningfully, with emerging markets Korea and Taiwan benefitting from demand across the global technology supply chain.
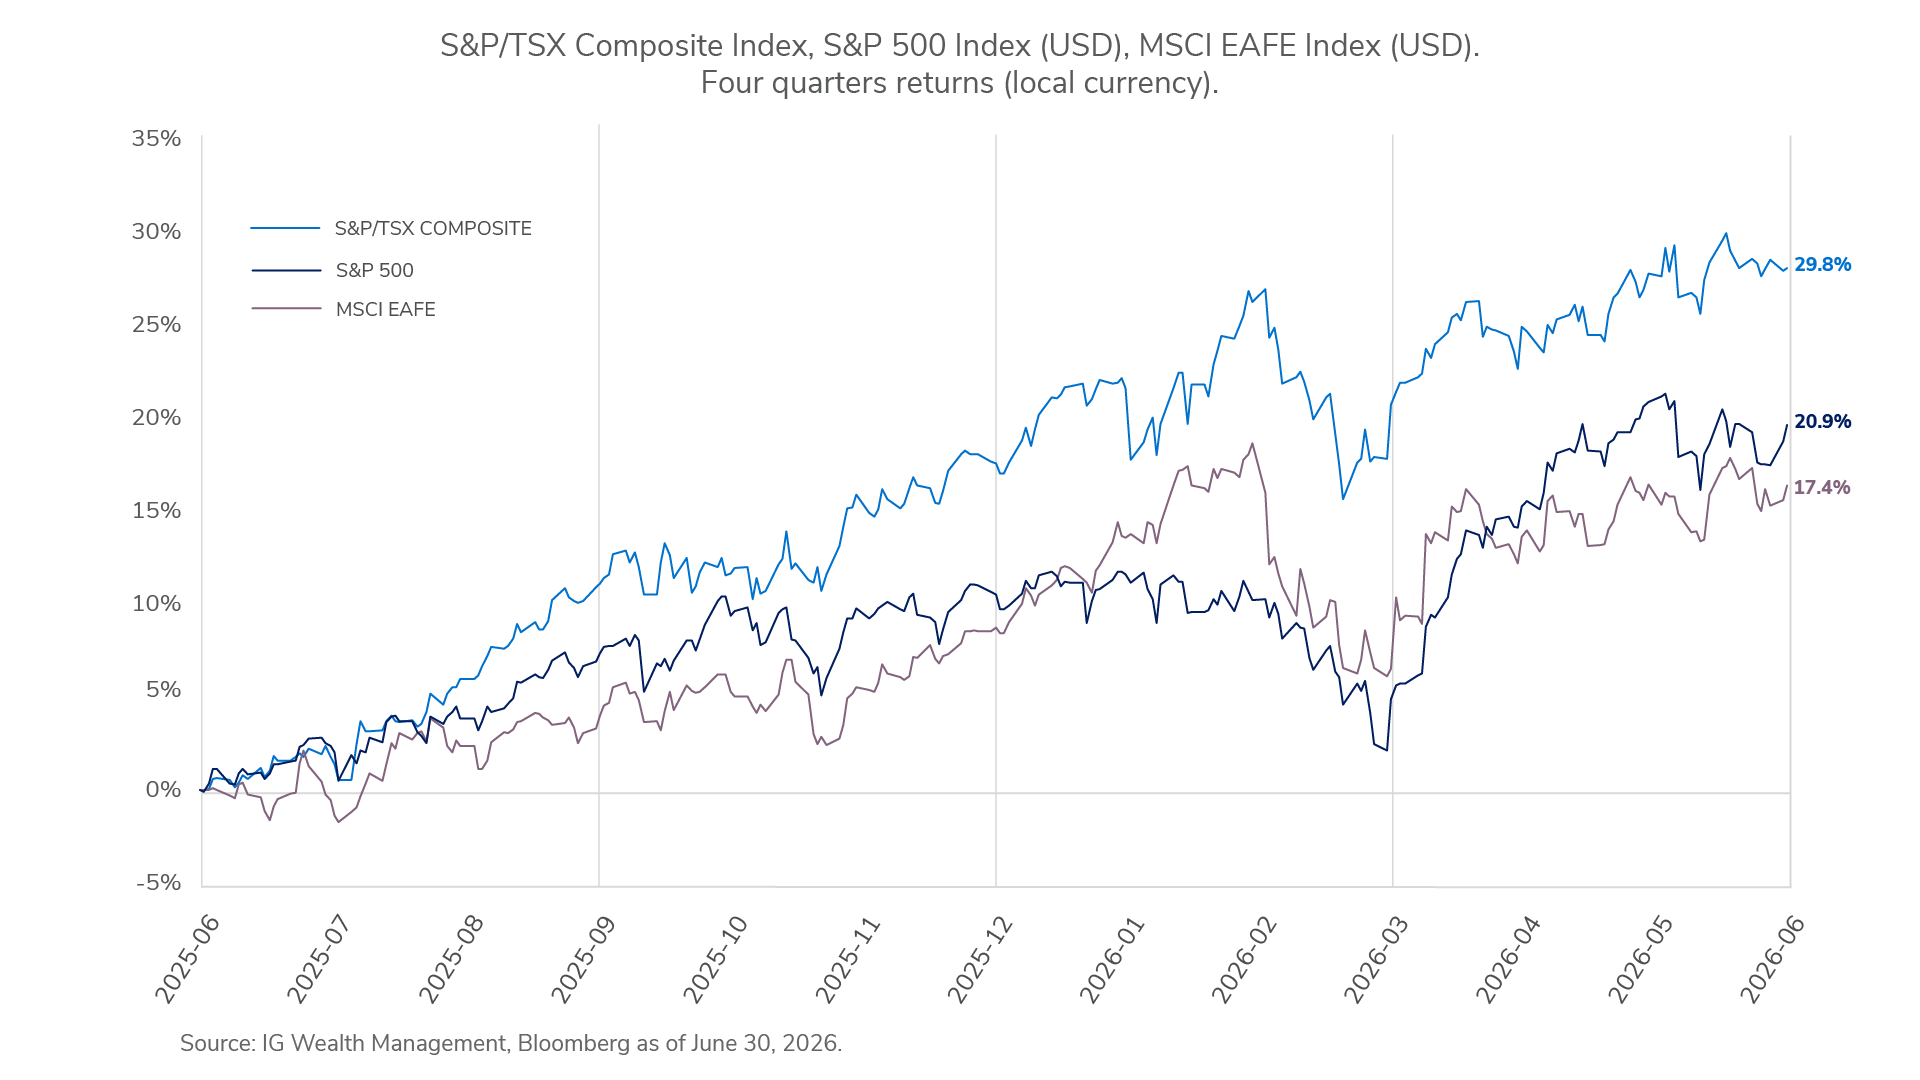
Our outlook for equities remains neutral. While the fundamental backdrop of the economy and corporate earnings remains strong, we are cautious of stretched retail investor positioning, which increases the vulnerability to sharp market sell-offs. From a relative standpoint, we favour U.S. small caps over Canadian equities. The robust U.S. economy continues to support U.S. small caps, which have remained undervalued for a prolonged period, whereas recent Canadian economic data has shown notable weakness. Additionally, we have closed our underweight position in European equities, as the region's economic data has begun to improve.
In fixed income, we maintain a neutral duration stance. Aggressive inflation-fighting rhetoric from the new U.S. Federal Reserve Chair has triggered a flattening of the yield curve, driving short-term yields higher as additional rate hikes are priced in, while long-term yields have declined on lower long-term inflation expectations. This unique curve dynamic, combined with persistently strong U.S. economic data, reinforces our measured and balanced approach to bond positioning.
Commissions, fees and expenses may be associated with mutual fund investments. Read the prospectus and speak to an IG Advisor before investing. The rate of return is the historical annual compounded total return as of June 30, 2026, including changes in value and reinvestment of all dividends or distributions. It does not take into account sales, redemption, distribution, optional charges or income taxes payable by any securityholder that would have reduced returns. Mutual funds are not guaranteed, values change frequently and past performance may not be repeated. Mutual funds and investment products and services are offered through the Mutual Fund Division of IG Wealth Management Inc. (in Quebec, a firm in financial planning). And additional investment products and brokerage services are offered through the Investment Dealer, IG Wealth Management Inc. (in Quebec, a firm in financial planning), a member of the Canadian Investor Protection Fund.
This commentary may contain forward-looking information which reflects our or third-party current expectations or forecasts of future events. Forward-looking information is inherently subject to, among other things, risks, uncertainties and assumptions that could cause actual results to differ materially from those expressed herein. These risks, uncertainties and assumptions include, without limitation, general economic, political and market factors, interest and foreign exchange rates, the volatility of equity and capital markets, business competition, technological change, changes in government regulations, changes in tax laws, unexpected judicial or regulatory proceedings and catastrophic events. Please consider these and other factors carefully and do not place undue reliance on forward-looking information. The forward-looking information contained herein is current only as of June 30, 2026. There should be no expectation that such information will in all circumstances be updated, supplemented or revised whether as a result of new information, changing circumstances, future events or otherwise.
This commentary is published by IG Wealth Management. It represents the views of our Portfolio Managers and is provided as a general source of information. It is not intended to provide investment advice or as an endorsement of any investment. Some of the securities mentioned may be owned by IG Wealth Management or its mutual funds, or by portfolios managed by our external advisors. Every effort has been made to ensure that the material contained in the commentary is accurate at the time of publication, however, IG Wealth Management cannot guarantee the accuracy or the completeness of such material and accepts no responsibility for any loss arising from any use of or reliance on the information contained herein.
Trademarks, including IG Wealth Management and IG Private Wealth Management, are owned by IGM Financial Inc. and licensed to subsidiary corporations.
©2026 IGWM Inc.