Portfolio returns: Q1 2026
| Total Return | 1M | 3M | YTD | 1YR | 3YR | 5YR | 10YR | Since Inc. (Aug 9, 2021) |
iProfile Portfolio – Global Fixed Income Balanced F | -2.66
| -0.03
| -0.03
| 6.28
| 6.81
| 3.35
| ||
Quartile rankings | 2 | 3 | 3 | 2 | 3 |
| Total Return | 1M | 3M | YTD | 1YR | 3YR | 5YR | 10YR | Since Inc. (Aug 9, 2021) |
iProfile Portfolio – Global Fixed Income Balanced F | -2.66
| -0.03
| -0.03
| 6.28
| 6.81
| 3.35
| ||
Quartile rankings | 2 | 3 | 3 | 2 | 3 |
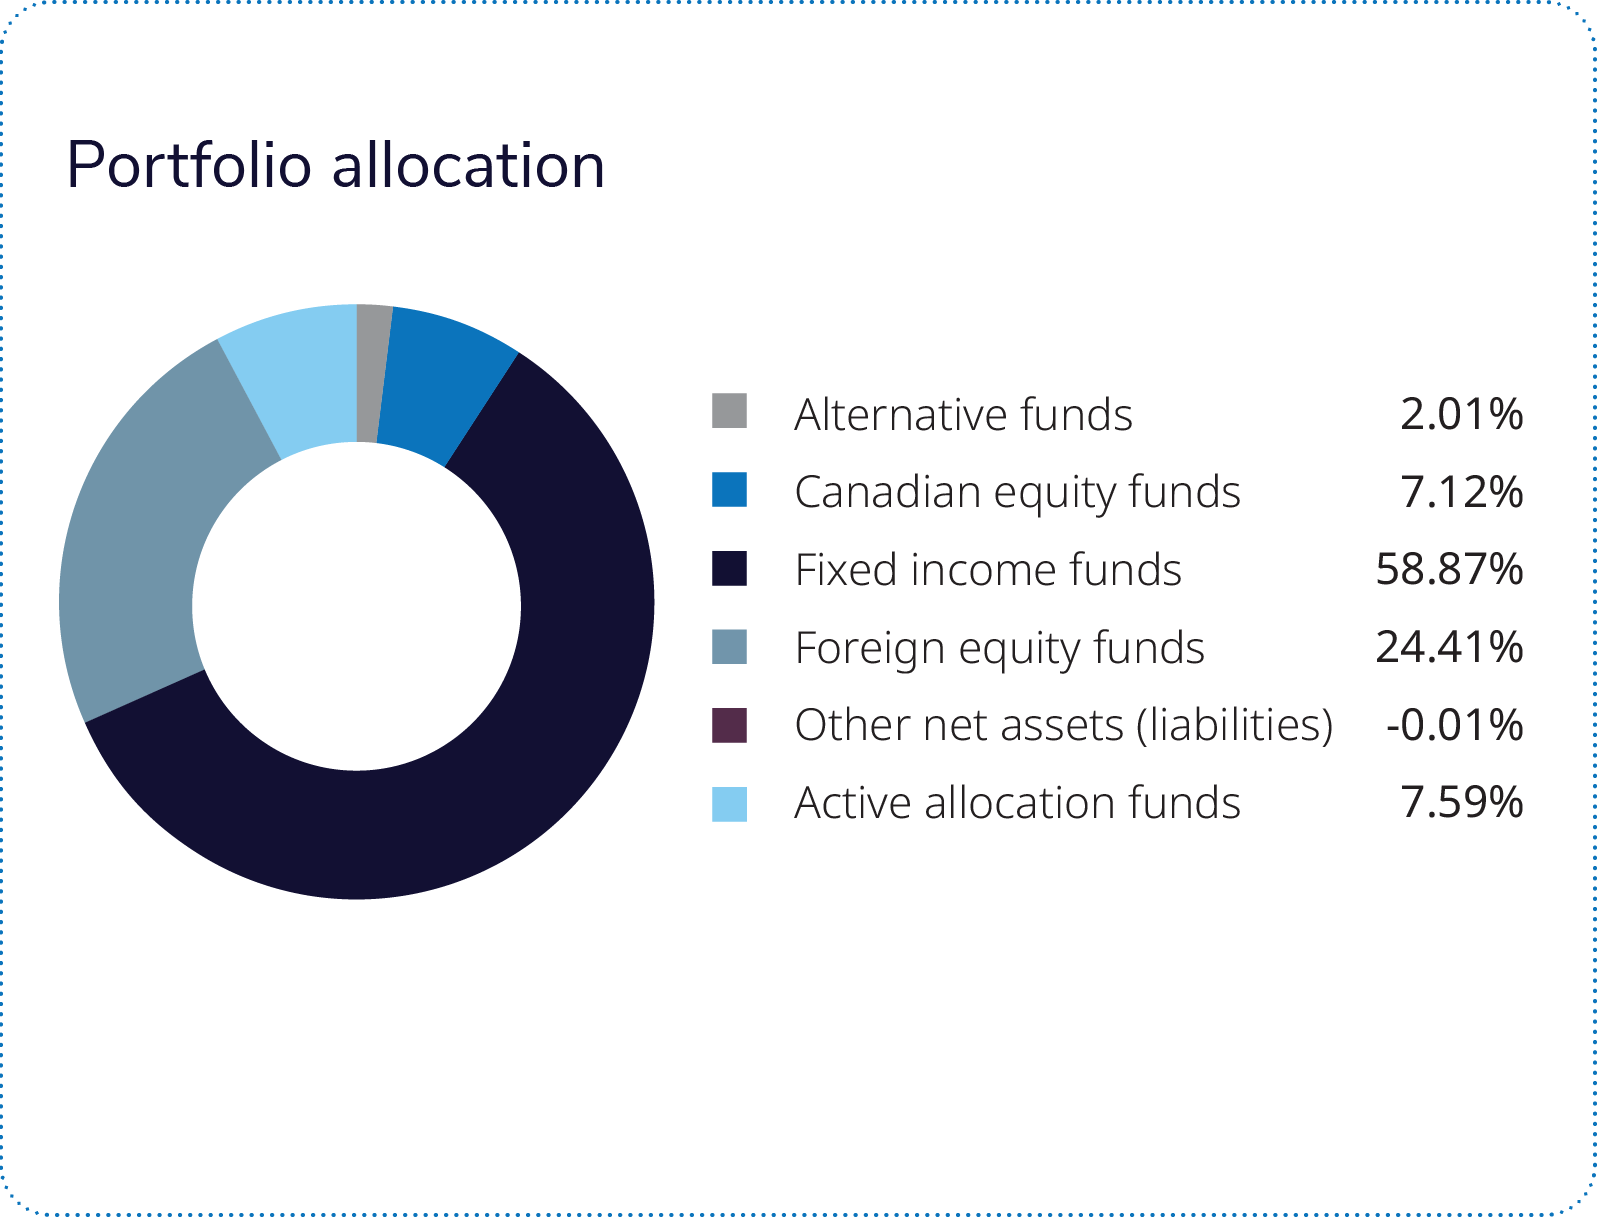 The iProfile™ Portfolio – Global Fixed Income Balanced, Series F, declined modestly over the first quarter of 2026 (-0.03%) in line with its global fixed income balanced peer group (0.02%). Most component sleeves contributed positively over the period, with the iProfile Canadian Equity Private Pool contributing most to total return, followed by the iProfile International Equity Private Pool and the iProfile Active Allocation Private Pool, while the PIMCO – IG Global Bond Pool and the iProfile U.S. Equity Private Pool were the primary detractors. However, the portfolio's core fixed income allocation faced significant headwinds that offset the positive contributions from equity exposures.
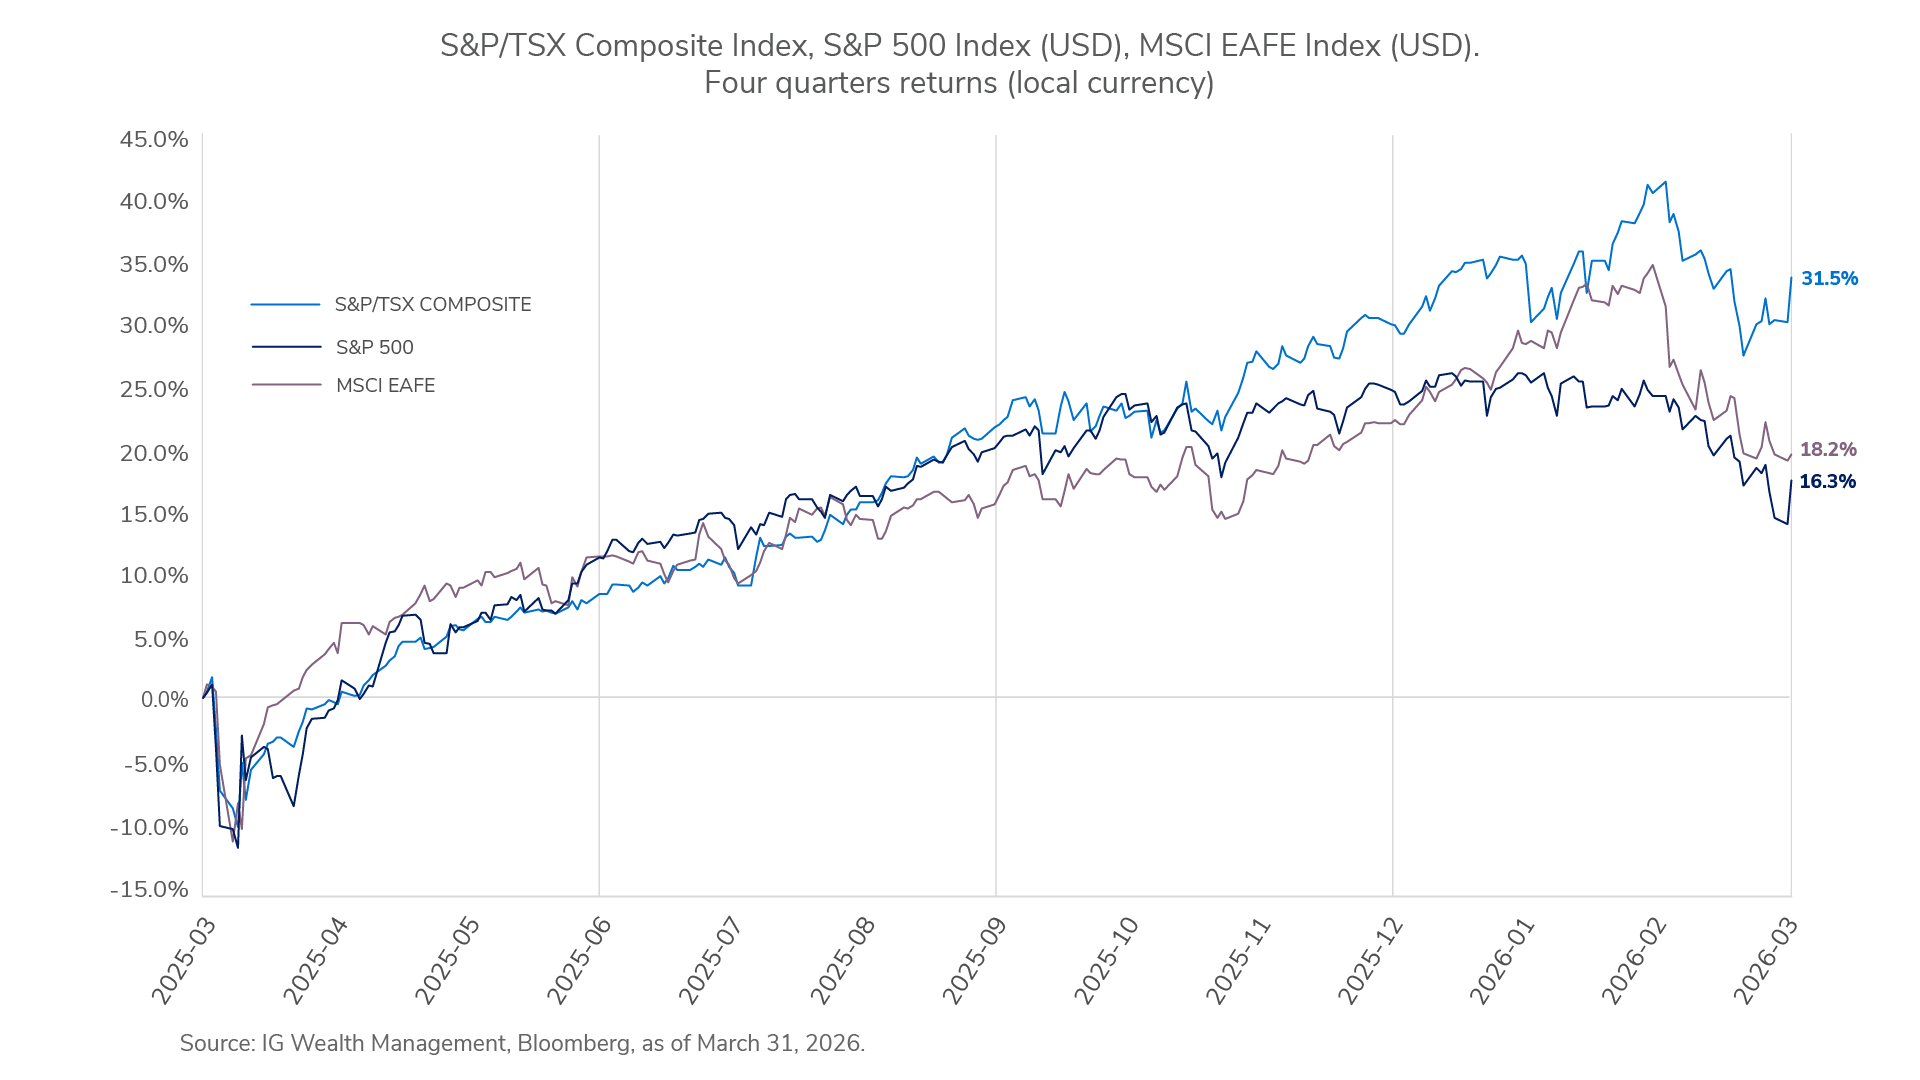
Market volatility increased in March 2026 as Middle East conflict escalated and energy prices spiked. Treasury yields rose during the quarter as inflation concerns persisted. High-yield bond spreads initially reached multi-year lows before widening again late in the quarter, in response to concerns about artificial intelligence and escalating tensions. Within the portfolio, this backdrop favoured Canadian and emerging equity positions, supported the active allocation sleeve's regional tilts and weighed on global bond and U.S. equity technology-heavy segments. As a result, the iProfile Canadian Equity Private Pool (2.8%), iProfile U.S. Equity Private Pool (-3.2%), iProfile International Equity Private Pool (2.0%), iProfile Emerging Markets Private Pool (5.8%), and iProfile ETF Private Pool (-0.7%), which together comprise approximately 23% of the portfolio, were the primary drivers of total return, more than offsetting headwinds from the core fixed income allocation.
The iProfile Canadian Equity Private Pool was the top contributor to total return. The pool benefited primarily from strong energy positioning, including overweight exposures to Cenovus Energy and Suncor Energy, as crude oil prices rose sharply during the quarter. These gains were partially offset by weaker results in consumer discretionary, where holdings such as Dollarama and Pet Valu declined, and by some softness in financials. The iProfile International Equity Private Pool also contributed meaningfully. Its underlying strength came largely from stock selection across communication services, information technology, health care and consumer staples, with support from names such as ASML Holding, Shell, TotalEnergies, Eni and BAE Systems. The iProfile Emerging Markets Private Pool provided additional support, despite its smaller weight, as strength in Samsung Electronics, SK hynix, Taiwan Semiconductor Manufacturing and selected Latin American commodity exposures supported results.
The iProfile Active Allocation Private Pool contributed positively to total return, though not enough to offset the broader headwinds. The quarter's result reflected BlackRock's shifting regional views, beginning with a preference for non-U.S. equities, particularly Korea, followed by continued conviction in Japan and broader Asian emerging markets, and ending with a more constructive U.S. equity overweight late in the quarter. Low-volatility sleeves provided some support. The BlackRock – IG Low Volatility International Equity Pool contributed positively, despite its modest weight, while the low-volatility Canadian and emerging market sleeves also added to returns. More broadly, low-volatility strategies benefited from stronger results in communication services, financials and selective energy holdings during a quarter in which higher-valuation technology and software names corrected. Among the portfolio's more income-oriented holdings, the Mackenzie – IG Canadian Bond Pool, the IG Mackenzie Mortgage and Short Term Income Fund and the IG Mackenzie Real Property Fund all contributed positively, with the real property sleeve supported by improving fundamentals in industrial properties and stable rental conditions. However, these positive contributions were insufficient to overcome the significant drag from the PIMCO – IG Global Bond Pool and iProfile U.S. Equity Private Pool allocations.
The PIMCO – IG Global Bond Pool was the most significant detractor from performance. It faced headwinds as U.S. corporate and government bond yields rose, inflation remained sticky, and expectations for U.S. Federal Reserve easing were reduced amid the quarter's oil-price shock and broader geopolitical uncertainty. The iProfile U.S. Equity Private Pool was the primary equity detractor. Weakness was concentrated in information technology, health care, communication services and financials, with Microsoft, Micron Technology and Capital One Financial among the notable detractors, although ConocoPhillips and Shell provided some offset through stronger energy exposure. Additional modest headwinds came from the Mackenzie Global Macro Fund, the iProfile ETF Private Pool, the IG Manulife Strategic Income Fund, the Mackenzie North American Corporate Bond Fund and the Wellington – IG Global Equity Hedge Pool. In this context, the portfolio's underperformance versus the category average reflected the significant drag from the PIMCO – IG Global Bond Pool and iProfile U.S. Equity Private Pool, which more than offset the otherwise strong contributions from Canadian, international and emerging equity exposures, active regional allocation and selected low-volatility sleeves. The portfolio's higher allocation to global bonds and U.S. equities relative to category peers detracted from relative performance during a quarter that favoured Canadian and international equity exposures.
The first quarter of 2026 began with supportive economic momentum; improving manufacturing, a stabilizing U.S. housing backdrop and contained inflation. However, this quickly pivoted as the conflict in the Middle-East involving Iran — along with trade disruption around the Strait of Hormuz — pushed energy commodities higher. The energy shock drove volatility across global equities, yet the underlying backdrop proved more resilient than headlines implied, reinforcing the value of diversification.
Canadian equities were resilient, as higher crude oil prices supported the energy sector and helped offset weaknesses in rate-sensitive areas. Defensive sectors, dividends and real-asset exposure provided additional insulation versus many global peers. U.S. fundamentals remained solid, but sentiment weakened as oil lifted inflation expectations. Investors rotated away from expensive, rate-sensitive growth stocks, making performance more about a valuation reset than deteriorating earnings.
Looking ahead, oil and energy prices remain the central swing factor. A credible path to de-escalation could shift attention back to the positive economic cycle evident early in the quarter; a prolonged disruption would maintain inflation uncertainty and elevated volatility.
In this environment, commodity producers and value‑oriented equities may provide resilience, while long‑duration assets and oil‑importing regions face greater sensitivity to energy-price fluctuations.
Canadian equities offer exposure to energy and materials supported by global supply constraints. International developed and emerging markets present valuation‑driven opportunities and help diversify away from concentrated U.S. equity exposure.
Within fixed income, short‑ to intermediate-duration strategies can balance yield and interest‑rate risk, complemented by high‑quality corporate bonds for disciplined income generation. Key areas to watch will be central bank policies, as they look at the impact of higher energy costs and their indirect tax on the consumer.
Commissions, fees and expenses may be associated with mutual fund investments. Read the prospectus and speak to an IG Advisor before investing. The rate of return is the historical annual compounded total return as of March 31, 2026, including changes in value and reinvestment of all dividends or distributions. It does not take into account sales, redemption, distribution, optional charges or income taxes payable by any securityholder that would have reduced returns. Mutual funds are not guaranteed, values change frequently and past performance may not be repeated. Mutual funds and investment products and services are offered through the Mutual Fund Division of IG Wealth Management Inc. (in Quebec, a firm in financial planning). And additional investment products and brokerage services are offered through the Investment Dealer, IG Wealth Management Inc. (in Quebec, a firm in financial planning), a member of the Canadian Investor Protection Fund.
This commentary may contain forward-looking information which reflects our or third-party current expectations or forecasts of future events. Forward-looking information is inherently subject to, among other things, risks, uncertainties and assumptions that could cause actual results to differ materially from those expressed herein. These risks, uncertainties and assumptions include, without limitation, general economic, political and market factors, interest and foreign exchange rates, the volatility of equity and capital markets, business competition, technological change, changes in government regulations, changes in tax laws, unexpected judicial or regulatory proceedings and catastrophic events. Please consider these and other factors carefully and do not place undue reliance on forward-looking information. The forward-looking information contained herein is current only as of March 31, 2026. There should be no expectation that such information will in all circumstances be updated, supplemented or revised whether as a result of new information, changing circumstances, future events or otherwise.
This commentary is published by IG Wealth Management. It represents the views of our Portfolio Managers and is provided as a general source of information. It is not intended to provide investment advice or as an endorsement of any investment. Some of the securities mentioned may be owned by IG Wealth Management or its mutual funds, or by portfolios managed by our external advisors. Every effort has been made to ensure that the material contained in the commentary is accurate at the time of publication, however, IG Wealth Management cannot guarantee the accuracy or the completeness of such material and accepts no responsibility for any loss arising from any use of or reliance on the information contained herein.
Trademarks, including IG Wealth Management and IG Private Wealth Management, are owned by IGM Financial Inc. and licensed to subsidiary corporations.
©2026 IGWM Inc.